Wednesday, 4 June 2014

Nifty chart: a mid-week update (Jun 04 ‘14)

Nifty_Jun0414

As was widely expected, the RBI Governor left interest rates unchanged, but lowered SLR by 50 bps (from 23% to 22.5%). Will it help the market in any way? Well, yes, and no.

SLR is the amount to be compulsorily invested by banks in government securities. A reduction in SLR should mean the release of several thousand Crores of liquidity into the market – hence, greater availability of credit for would-be borrowers.

However, most banks invest much more than the SLR stipulated amount in government securities any way – perhaps because there are fewer borrowers in a slow economy. So, the reduction in SLR may not filter down to the market for several months.

The upward ‘gap’ of about 47 points, formed on May 13, still remains unfilled. Last Friday’s intra-day drop found support from the rising 20 day EMA and did not test support from the ‘gap’.

After the gyrations on May 16 (election results day), Nifty has settled into a sideways consolidation from which the likely break out should be upwards. Even if the index drops to fill or partly fill the ‘gap’, the up move should resume thereafter.

Daily technical indicators have corrected overbought conditions, and remain in bullish zones. MACD and RSI are still in their overbought zones. ROC has bounced up from the ‘0’ line. Slow stochastic has bounced up from its 50% level. Some more consolidation is possible.

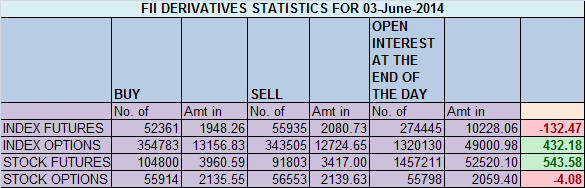
FIIs have invested a net Rs 1000 Crores during the first three trading sessions in June. They are probably waiting for positive policy announcements to increase their buying.
It is a bull market. Remain long.

Tuesday, 3 June 2014

Gold and Silver charts: bottoms fall out

Gold Chart Pattern

Gold_Jun0214

The following comments were made in a technical update two weeks ago on gold’s daily bar chart pattern: “Bulls will try to defend the support zone between 1260-1280. But for how long?”

It took exactly six trading sessions for gold’s price to close below the 1260 level on strong volumes. So, the downward breach of the support zone between 1260-1280 is confirmed, right? Technically, not yet. Why? Because the 3% ‘whipsaw’ rule means only a close below 1222 will confirm the breach.

Looks like gold’s price is trying to find a bottom at 1240, from where it may attempt a pullback towards the 1260-1280 zone. If the zone now turns into a resistance zone, which it should, then the pulback may be short-lived. Gold’s price is likely to drop all the way down to test the Dec 31 ‘13 low of 1180.

All three daily technical indicators are in their respective oversold zones, which increases the probability of a pullback towards the 1260 level. That would be a good opportunity to short.

On longer term weekly chart (not shown), all three weekly EMAs are moving down and gold’s price is trading below them in a bear market.

Silver Chart Pattern

Silver_Jun0214

Two weeks back, the following observation was made about the daily bar chart pattern of silver: “All three indicators have formed bullish patterns of rising tops and rising bottoms, which may lead to another attempt at a rally past the falling 50 day EMA.”

Silver’s price did climb above its falling 50 day EMA on intra-day basis (on May 22), but touched a lower top. It subsequently dropped on strong volumes and moved down below the 18.75 level – its previous low touched on Dec 31 ‘13. Silver’s price has closed exactly at 18.75, and may attempt to bounce up from here.

Technical indicators are looking bearish. MACD has crossed below its signal line in negative territory. RSI has dropped to the edge of its oversold zone. Slow stochastic is inside its oversold zone. Bears are likely to use every rise to sell.

On longer term weekly chart (not shown), all three weekly EMAs are sliding down and silver’s price is trading below them in a bear market.

Nifty closes above 7400,FII Data Analsysis

FII’s sold 3.5 K contract of Index Futures worth 132 cores (7.9 K longs were squared off and 4.3 K shorts were squared off in Index Future) with net OI decreasing by 12.2 K contracts.FII’s squared off both long and shorts.
As discussed in Weekly Analysis Nifty as per Gann grid is having strong support at red line marked by Green arrow and strong resistance in red line as shown with red arrow in below chart. Nifty took exact support at 7239 green line and is moving near the green line in range of 7430-7450. On Hourly charts Nifty is near the downward trendline resistance, also as per EW we might make a short term top in range of 7450-7460 and than a pull back.

Monday, 2 June 2014

S&P 500, FTSE 100 charts: near new lifetime highs

S&P 500 Index Chart

S&P 500_May3014

The 6 months daily bar chart pattern of S&P 500 soared past its previous (May 13) top of 1902 and closed above the 1920 level at a new lifetime high. Concerns of a possible ‘double top’ at 1900 were left by the wayside.

Volumes picked up a bit on Friday, but overall volumes during the week were subdued. All three EMAs are rising and the index is trading above them. However, the index is a good 30 points above its 20 day EMA. That makes it prone to a correction.

Daily technical indicators are bullish, but looking overbought. MACD has entered overbought territory. RSI is rising towards its overbought zone. Slow stochastic is well inside its overbought zone.

The index is in ‘blue-sky’ territory with no known resistances. In such situations, resistance often comes from round index levels. Note the resistance from the 1900 level in April and May.

So, where will the next likely resistance be? Possibly at 1950. Stay invested with a trailing stop-loss.

FTSE 100 Index Chart

FTSE_May3014

The 6 months daily bar chart pattern of FTSE 100 moved above the 6850 level but failed to test its May 15 top of 6895. It dropped to close below the 6850 level – but gained about 0.4% for the week.

Friday’s volumes were the highest in a month, which could be a sign of ‘distribution’. Selling near a previous top is quite common. All three EMAs are rising and the index is trading above them. There is no immediate threat to the long-term bull market.

Daily technical indicators are in bullish zones, but looking weak. MACD is sliding below its signal line in positive territory. RSI and Slow stochastic is falling towards their respective 50% levels.
Stay invested but maintain a stop-loss to protect profits.

Bottomline? Daily bar chart patterns of S&P 500 and FTSE 100 are in long-term bull markets. S&P 500 rose to touch a new lifetime high. FTSE 100 is consolidating after touching a new lifetime high. Book part profits or stay invested with suitable stop-losses.

Sunday, 1 June 2014

NIFTY FUTURES / BANK NIFTY FUTURE CALLS IN MARKET HOURS AND MARKET OUTLOOK – 2.6.2014

Nifty ( Spot ) : The crucial support for the Nifty is at 7220 – 7150 – 7120  and the resistance is at  7275 – 7320
Pre-market Future Call ( Intraday) :
YESBANK  —  Buy above  570.50  StopLoss  564 Target 575 , 581
Short Sell below 564  StopLoss 570 Target 558 , 552
Pre-market Future Call ( Intraday) :
DLF  — Buy above 214  StopLoss 210  Target  217.50 , 221
Short Sell below 210  StopLoss 214 Target 206 , 203

Sensex, Nifty charts: correcting overbought conditions

BSE Sensex and NSE Nifty 50 index chart patterns – May 30, 2014

The stock market was in a corrective mode through the week, with both Sensex and Nifty losing ground. The GDP number for 2013-14 was marginally higher than the previous year at 4.7%, but marked the second straight year below the 5% mark. The economy appears to have bottomed out.

Despite some recent profit booking, FIIs were net buyers of almost Rs 15000 Crores in equities for the month of May ‘14. DIIs were net sellers of Rs 4600 Crores. After the sharp price spurt from May 9 to May 16, both indices entered a sideways consolidation that has corrected overbought conditions.

Corrections and consolidations are essential ingredients of index movements. Such pauses in bull markets improve the technical ‘health’ of chart patterns and provide ‘energy’ for the next up move. You can either wait out these corrective moves, or use them to add to existing portfolios.


BSE Sensex index chart

SENSEX_May3014
The upward ‘gap’ on Sensex chart formed on May 13 has remained unfilled till date. It is expected to support the index from falling much further. Remember that part or complete filling of the ‘gap’ has bullish implications - the index is supposed to resume its up move thereafter.

Daily technical indicators are correcting overbought conditions. MACD has crossed below its signal line and looks ready to drop from its overbought zone. ROC has dropped sharply below its 10 day MA and is about to enter negative territory. RSI has slipped from its overbought zone. Slow stochastic has dropped to its 50% level.

Some more correction or consolidation is possible. Sensex may test support from the ‘gap’.

NSE Nifty 50 index chart

Nifty_May3014

Nifty’s weekly bar has formed a ‘reversal week’ pattern (higher high, lower close) on strong volumes. The corrective move may continue next week – but a big correction is not expected.

Weekly technical indicators have started correcting overbought conditions, but remain in bullish zones. MACD is well inside its overbought zone, but its upward momentum is slowing down. ROC has dropped towards its 10 week MA inside overbought zone. RSI has formed a small ‘rounding top’ reversal pattern inside overbought territory. Slow stochastic has dropped to the edge of its overbought zone.

Hold existing positions, or use the dip to add.
Bottomline? Chart patterns of BSE Sensex and NSE Nifty indices have been correcting after closing at new lifetime highs in the previous week. Expect the indices to resume their up moves soon. If you want to enter now, start a SIP in a good index or balanced fund instead of trying your luck with individual stocks.

Bank Nifty Weekly Forecast for RBI Policy week

Last Week we gave Bank Nifty Chopad level of 15306 and Bank Nifty did all 3 target on downside rewarding traders with 387 points, We have RBI policy coming on Tuesday so big moves are on cards again. Bank Nifty will likely to see a good trending move.
Bank Nifty hourly charts is entering in supply zone, with hourly charts moving in oversold zone suggesting if range of 14700-14620 is held we can see bounce back till 15000-15200 odd levels.